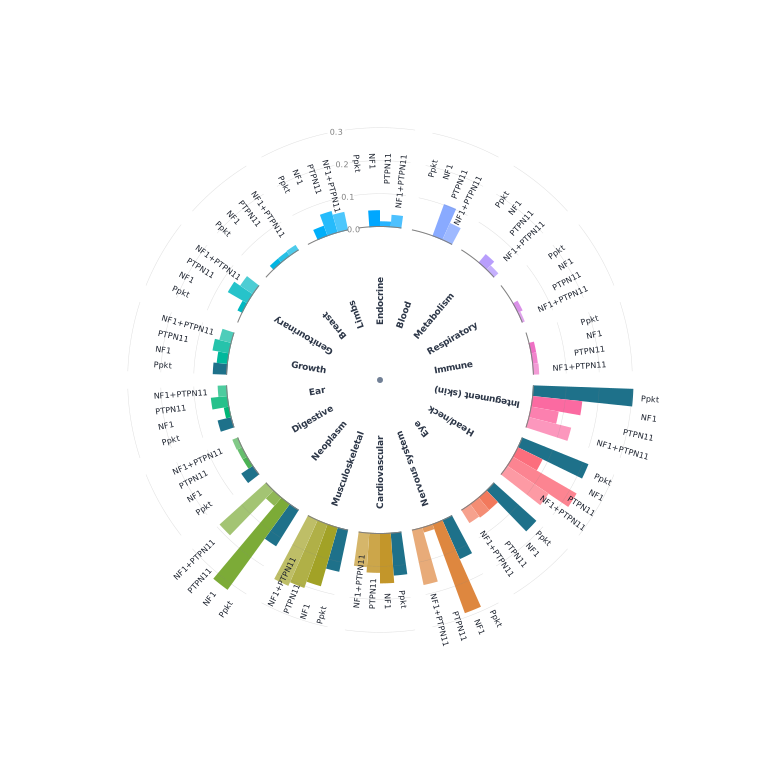
Phenotype Profile Plot
Phenotype Profile Plots are spread plots that visualize the organ distribution of features in an individual as compared to the distribution of features in the diseases. The organs correspond to the top-level organ terms in the Human Phenotype Ontology. For instance, nervous system corresponds to Abnormality of the nervous system (HP:0000707) and endocrine corresponds to Abnormality of the endocrine system (HP:0000818).
Each organ shows bars that correspond to counts
- ppkt: The count of HPO terms in the phenopacket that represent abnormalities in the corresponding organ
- gene symbol: The count of HPO terms in the disease model corresponding to the gene symbol that represent abnormalities in the corresponding organ. In the figure shown below, the gene symbols are NF1 and PTPN11.
- combination: The count of HPO terms that are common to both (or all) of the disease models for individual genes. In the figure shown below, the combination is NF1+PTPN11.
Counts are represented as proportions as a radar plot.